Auroral forecast based on the OVATION Prime model
The OVATION model provides estimates of where the aurora might be visible. The images show both where the aurora is most likely to be observed as well as how bright it might be. The model also calculates a globally integrated total energy deposition in gigaWatts (GW). This is referred to as the Hemispheric Power and ranges from 5 to 150. For values below about 20, there may be little or no aurora observable. For values between 20 and 50, you may need to be near the aurora to see it. For values above 50, the aurora should be quite observable with lots of activity and motion across the sky. Once the Hemispheric Power reaches levels of 100 or more, this is considered to be a very significant geomagnetic storm and the aurora may be seen from hundreds of miles away.
Click to swap between North and South maps  [VIDEO]
[VIDEO]
—
Additional data: SSUSI
Due to a lack of funding for the the SSUSI project, the data is now unavailable.
SSUSI remotely senses the physical and chemical processes in the Earth’s upper atmosphere. Measurements are made from the extreme ultraviolet (EUV) to the far ultraviolet (FUV) over the wavelength range of 80 nm to 170 nm, with 1.8 nm resolution. The DMSP satellites are launched in near-polar, sun-synchronous orbits at an altitude of approximately 850 km.
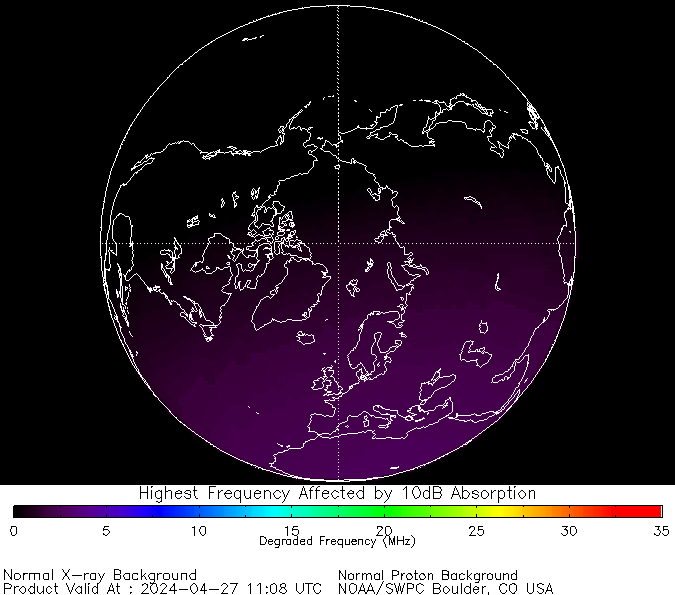
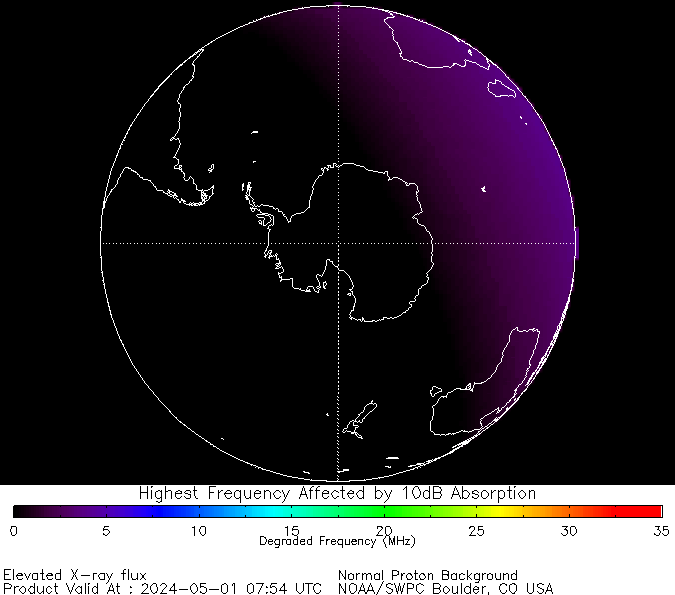
Additional data: D-region absorption
Conditions in the D-region of the ionosphere have a dramatic effect on high frequency (HF) communications and low frequency (LF) navigation systems. These D-RAP maps depict the D-region at high latitudes by showing the highest frequency affected by absorption of 10 dB due to primarily to SEP events.
NORTHERN HEMISPHERE
SOUTHERN HEMISPHERE
Courtesy of NOAA/SWPC/CCMC/JHUAPL (OVATION/DRAP/SSUSI)
