Geospace Global Geomagnetic Activity
Geomagnetic activity can affect communications, navigation systems, satellite health, power grids, and space travel.
Kp is one of the most common indices used to indicate the severity of the global magnetic disturbances in near-Earth space.
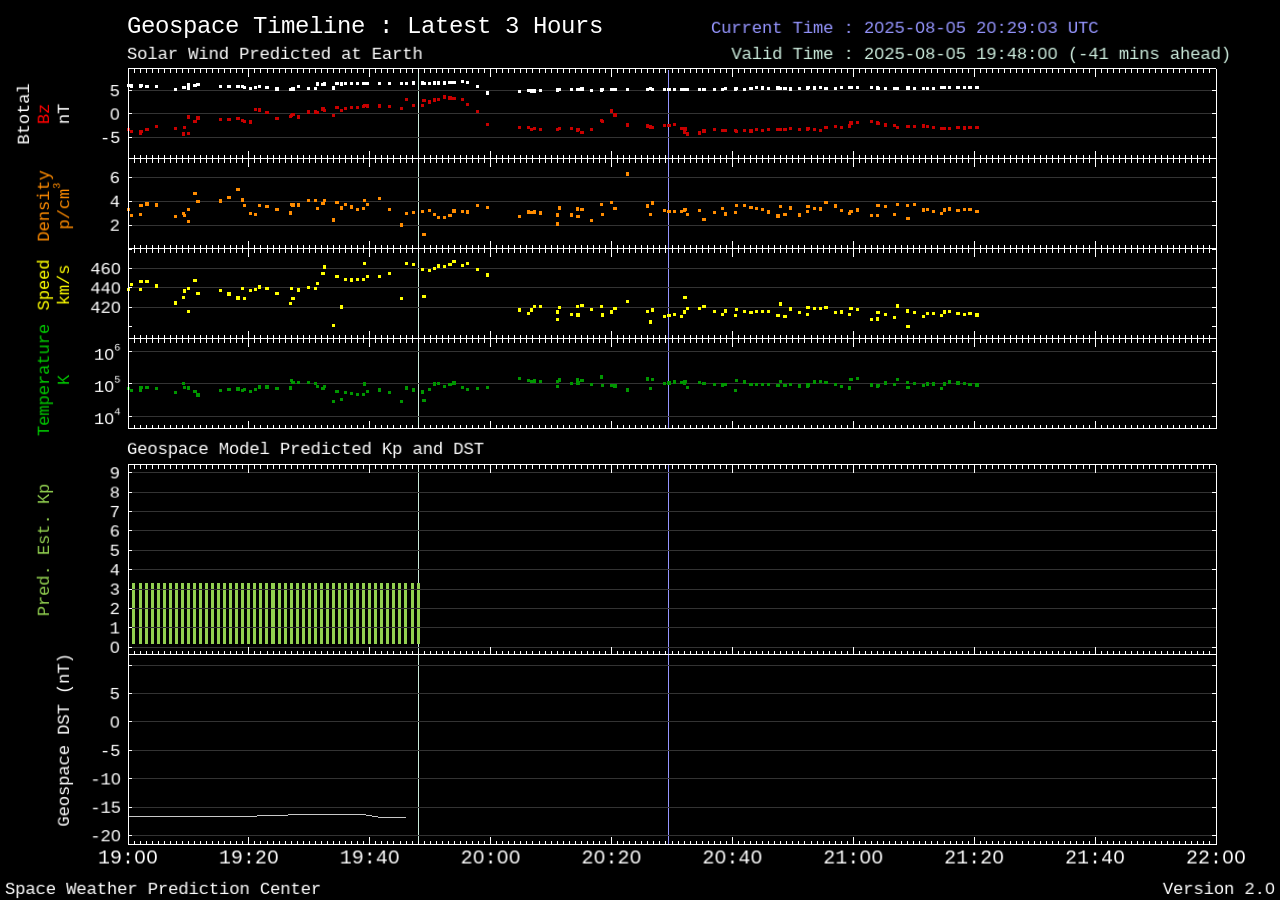
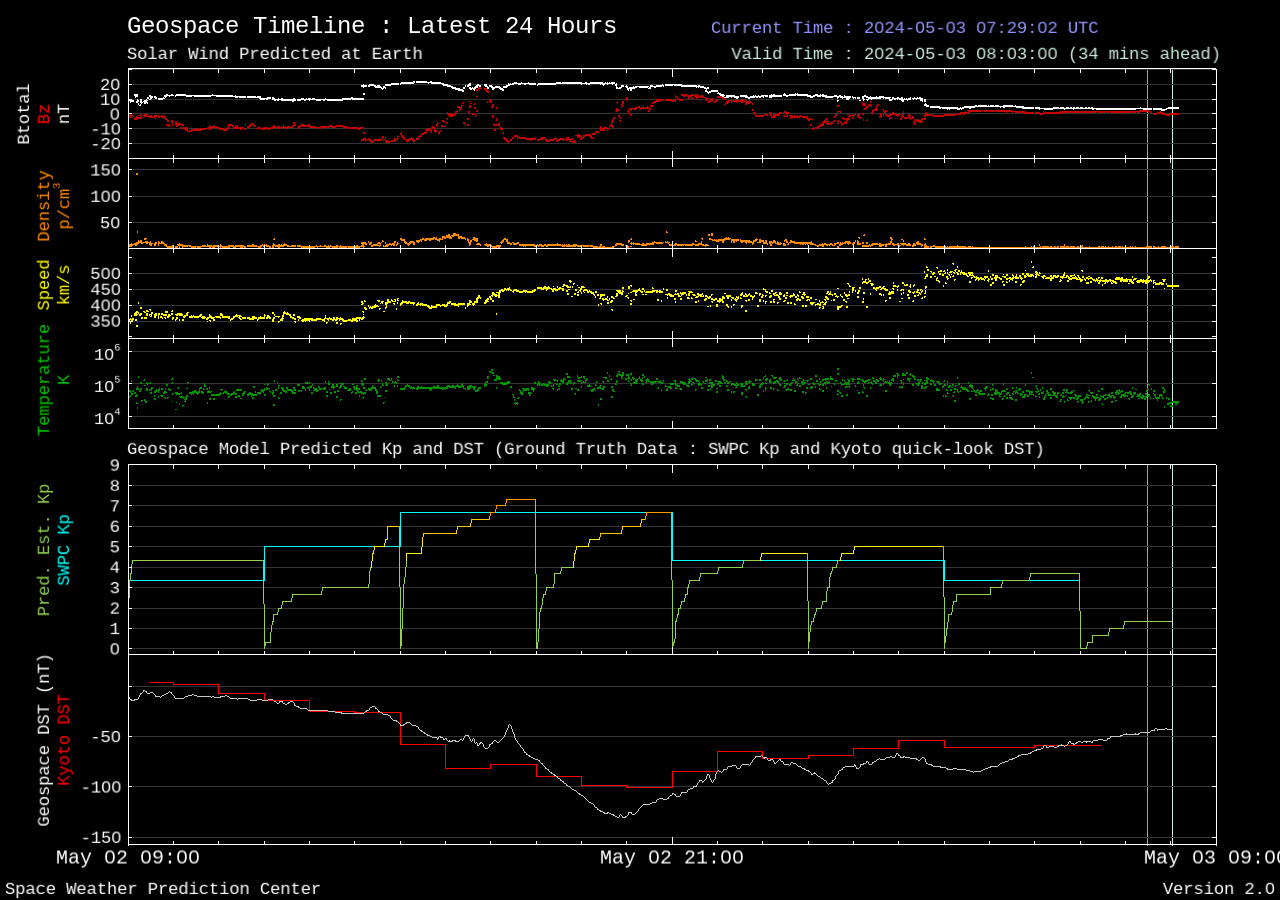
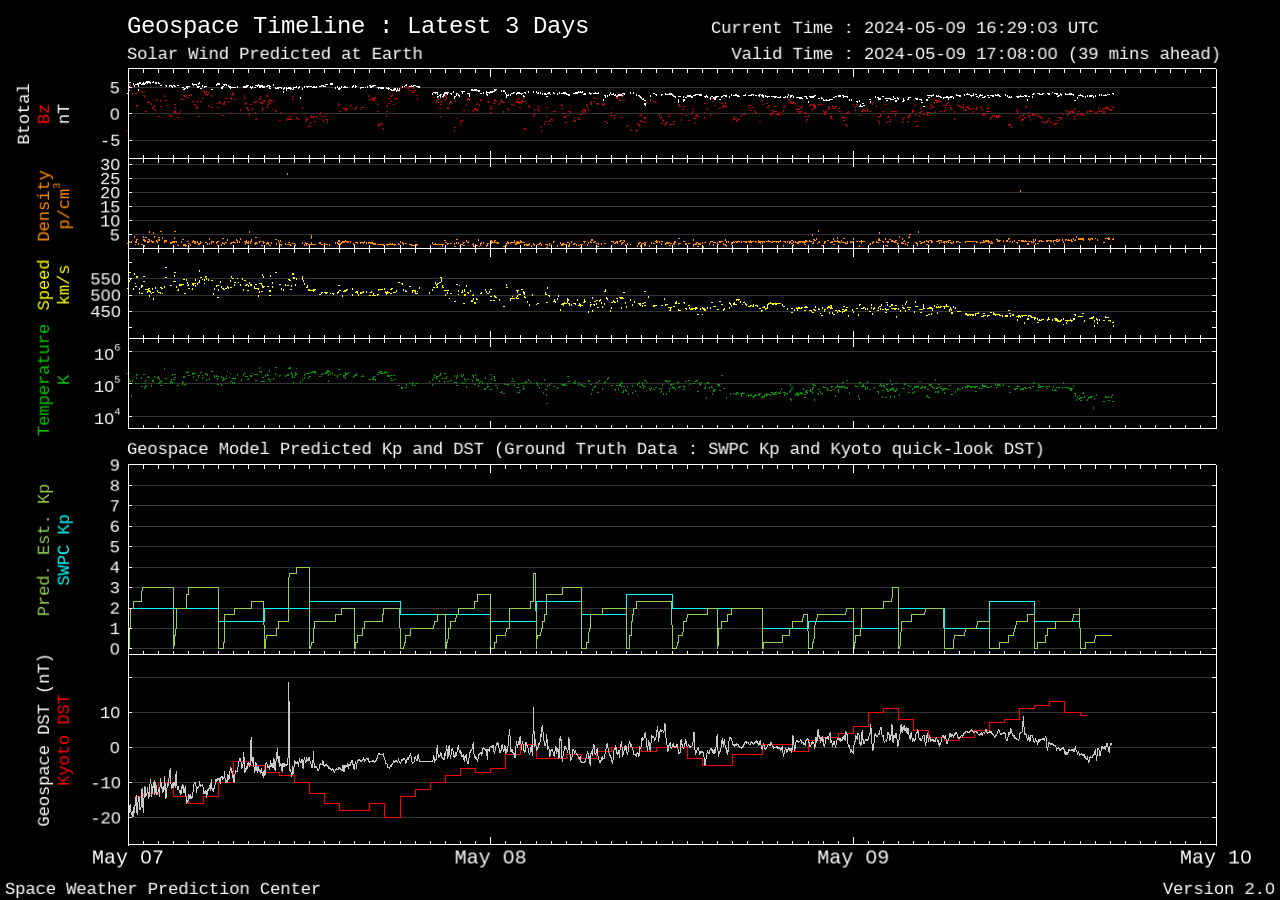
The Geospace Global Geomagnetic Activity Plot displays real-time solar wind values ballistically propagated from L1 orbit to 32 Re at the upstream boundary of the University of Michigan’s Geospace model (top four plots). The propagated solar wind values are used to drive the University of Michigan’s Geospace model which outputs 1-minute predicted Kp and Dst values (bottom two plots). In addition to the forecast values for Kp (colored line, where color depends on level of activity) and Dst (white line), the ground truth data for Kp (SWPC estimated 3-hour Kp; teal line) and Dst (Kyoto 1-hour quick look Dst; red line) are plotted for comparison.
Geospace Global Geomagnetic Activity plot
Courtesy of NOAA/SWPC/University of Michigan/WDC-G Kyoto/GFZ.
