Live data from the Geostationary Operational Environmental Satellite(s) (GOES)
Measured by the GOES satellites (current satellite(s): GOES-19/GOES-18). Spikes are considered significant when they rise above the “M” (10-5W/m2) level. The plot shows the solar X-ray output in the 1-8Å (0.1-0.8 nm) and 0.5-4.0Å (0.05-0.4 nm) passbands.
Current 5-minute averaged integral proton flux. At the moment the levels are measured by the SWPC GOES-19 or GOES-18 satellite. SWPC`s proton event threshold is 10 protons/cm2s-1sr-1 at ≥10 MeV.
Current 5-minute averaged integral electron flux. The plot shows flux with energies ≥2 MeV (GOES-19/GOES-18). The data in this plot is invalid during a significant proton event because of sensor contamination at the GOES spacecraft.
Current 1-minute averaged parallel component of the magnetic field. Measured in nanoTeslas (nT) at GOES-19/GOES-18. The GOES spacecraft use hydrazine arcjet thrusters for periodic orbital maneuvers to maintain the desired geostationary location. During arcjet operation, the magnetometer measurements are corrupted by ~20 nT, which is significant relative to the typical 100 nT geomagnetic field magnitude at geostationary orbit.
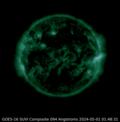
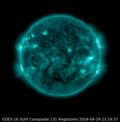
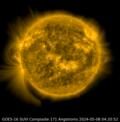
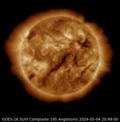
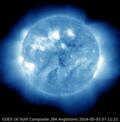
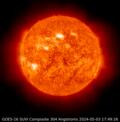
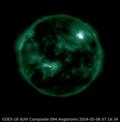
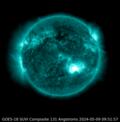
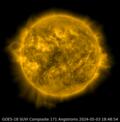
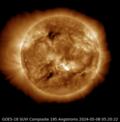
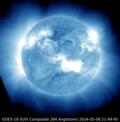
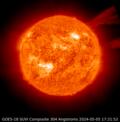
GOES-R SUVI
The Solar Ultraviolet Imager (SUVI) is a telescope that monitors the sun in the extreme ultraviolet wavelength range. By observing the sun, SUVI is able to compile full disk solar images around the clock. It replaces the GOES Solar X-ray Imager (SXI) instrument and represents a change in both spectral coverage and spatial resolution over SXI.
CCOR1
—
Additional data
The Estimated 3-hour Planetary K index is derived at the NOAA SWPC using data from ground-based magnetometers in Boulder (Colorado), Chambon la Foret (France), Fredericksburg (Virginia), Fresno (California), Hartland (UK), Newport (Washington), Sitka (Alaska) and Jeju (Korea). Kp indices of 5 or greater indicate storm-level geomagnetic activity.
Conditions in the D region of the ionosphere have a dramatic effect on high frequency (HF) communications and low frequency (LF) navigation systems. The global D Region Absorption Predictions (D-RAP) depicts the D region at high latitudes where it is driven by particles as well as low latitudes, where photons cause the prompt changes.
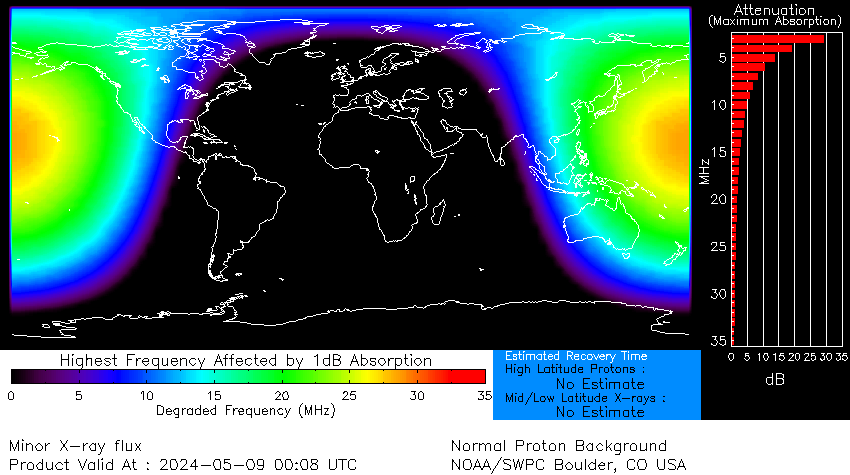
1dB ABS | 5MHz | 10MHz | 15MHz | 20MHz | 25MHz | 30MHz
—
Strongest X-ray solar flares recorded

--------------------------------------------
RANK              DATE                CLASS
--------------------------------------------
  1             04-11-2003              X28+*
  2             02-04-2001              X20.0
  2             16-08-1989              X20.0
  3             28-10-2003              X17.2
  4             07-09-2005              X17.0
  5             06-03-1989              X15.0
  5             11-07-1978              X15.0
  6             15-04-2001              X14.4
  7             24-04-1984              X13.0
  7             19-10-1989              X13.0
  8             15-12-1982              X12.9
  9             06-06-1982              X12.0
  9             01-06-1991              X12.0
  9             04-06-1991              X12.0
  9             06-06-1991              X12.0
  9             11-06-1991              X12.0
  9             15-06-1991              X12.0
  10            17-12-1982              X10.1
  10            20-05-1984              X10.1
  11            29-10-2003              X10.0
  11            25-01-1991              X10.0
  11            09-06-1991              X10.0
  12            09-07-1982              X9.8
  12            29-09-1989              X9.8
  13            22-03-1991              X9.4
  13            06-11-1997              X9.4
  14            24-05-1990              X9.3
  14            06-09-2017              X9.3
  15            05-12-2006              X9.0
  15            06-11-1980              X9.0
  15            02-11-1992              X9.0
--------------------------------------------
* Taking a different route, researchers from the University of Otago used radio wave-based measurements of the x-rays’ effects on the Earth’s upper atmosphere to revise the flare’s size from a merely huge X28 to a “whopping” X45, say researchers Neil Thomson, Craig Rodger, and Richard Dowden.
Courtesy of NOAA/SWPC.

