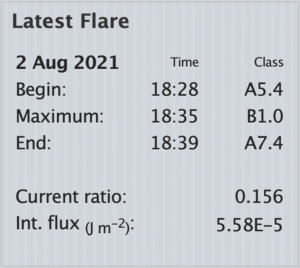
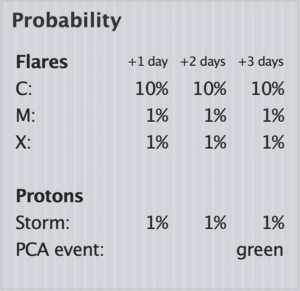
Two new sidebar widgets have been developed and added – the (flare) Probability and the Latest flare one.

The Latest flare widget shows the date of the last detected X-ray flare by the GOES satellite along with the begin, maximum and end times. It also shows the class of the flare at these three moments as well as the current ratio of the X-ray flux and the integrated value.

The Probability widget shows the probabilities for C, M and X flares for the next three days in percents. It also shows the probability for elevated proton levels (≥10MeV) above the storm threshold value (10 protons/cm2s-1sr-1) and the probability for a polar cap absorption (PCA) event created by such a storm.
