POES data
This product is now superseded by OVATION-Prime
Auroral Activity extrapolated from NOAA POES satellite.
The plots show the current extent and position of the auroral oval at each pole, extrapolated from measurements taken during the most recent polar pass of the POES satellite. The red arrow points toward the noon meridian.
The process to estimate the hemispheric power, and the level of auroral activity, involves using a normalization factor (n) which takes into account how effective the satellite was in sampling the aurora during its transit over the polar region. A large (n>2.0) normalization factor indicates that the transit through the aurora was not very effective and the resulting estimate of auroral activity has a lower confidence.
NORTHERN HEMISPHERE
SOUTHERN HEMISPHERE
—
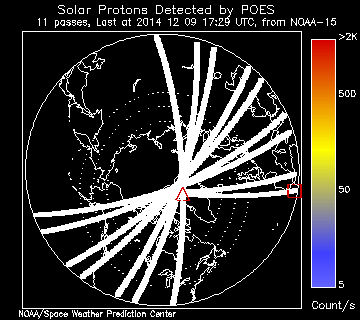
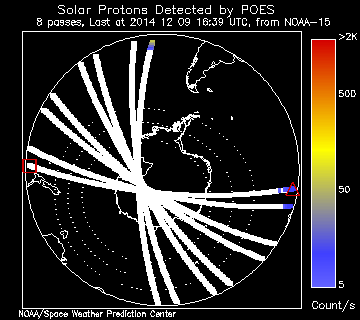
Solar Protons Detected by POES
The plots displayed below are designed to provide an up-to-date picture of the extent of the Northern and Southern polar area being affected during an SPE (Solar Proton Event). This also provides an indication of those HF radio propagation paths that will be badly degraded because of the signal absorption. The 16-second averaged count rates from the >15 MeV (nominally 15 -70 MeV) proton detector on each satellite are color coded and plotted along that satellite’s transit.
NORTHERN HEMISPHERE
SOUTHERN HEMISPHERE
—
NOAA POES – Relative Intensities of energetic particles
The display below shows the responses of the 90° electron sensor to >30 keV electrons throughout the day compared with the median responses of that detector over the past year. The red box shows the satellite location at the beginning of the day. The red triangle shows its location at the time of the last data download.
Courtesy of NOAA/SWPC (POES).
